Learn Excel for Data Visualization with online classes across India. Build dashboards, charts, real-world projects & get certified. Beginner-friendly training.
Master Excel Data Visualization with India’s most practical and career-focused training program. Study Solution offers Excel online classes across India, allowing you to learn Excel from home with live sessions, real datasets, and expert guidance. Our program is designed for students, beginners, and professionals who want to upgrade their skills in Excel dashboard training, Excel data analysis, and data visualization using Excel.
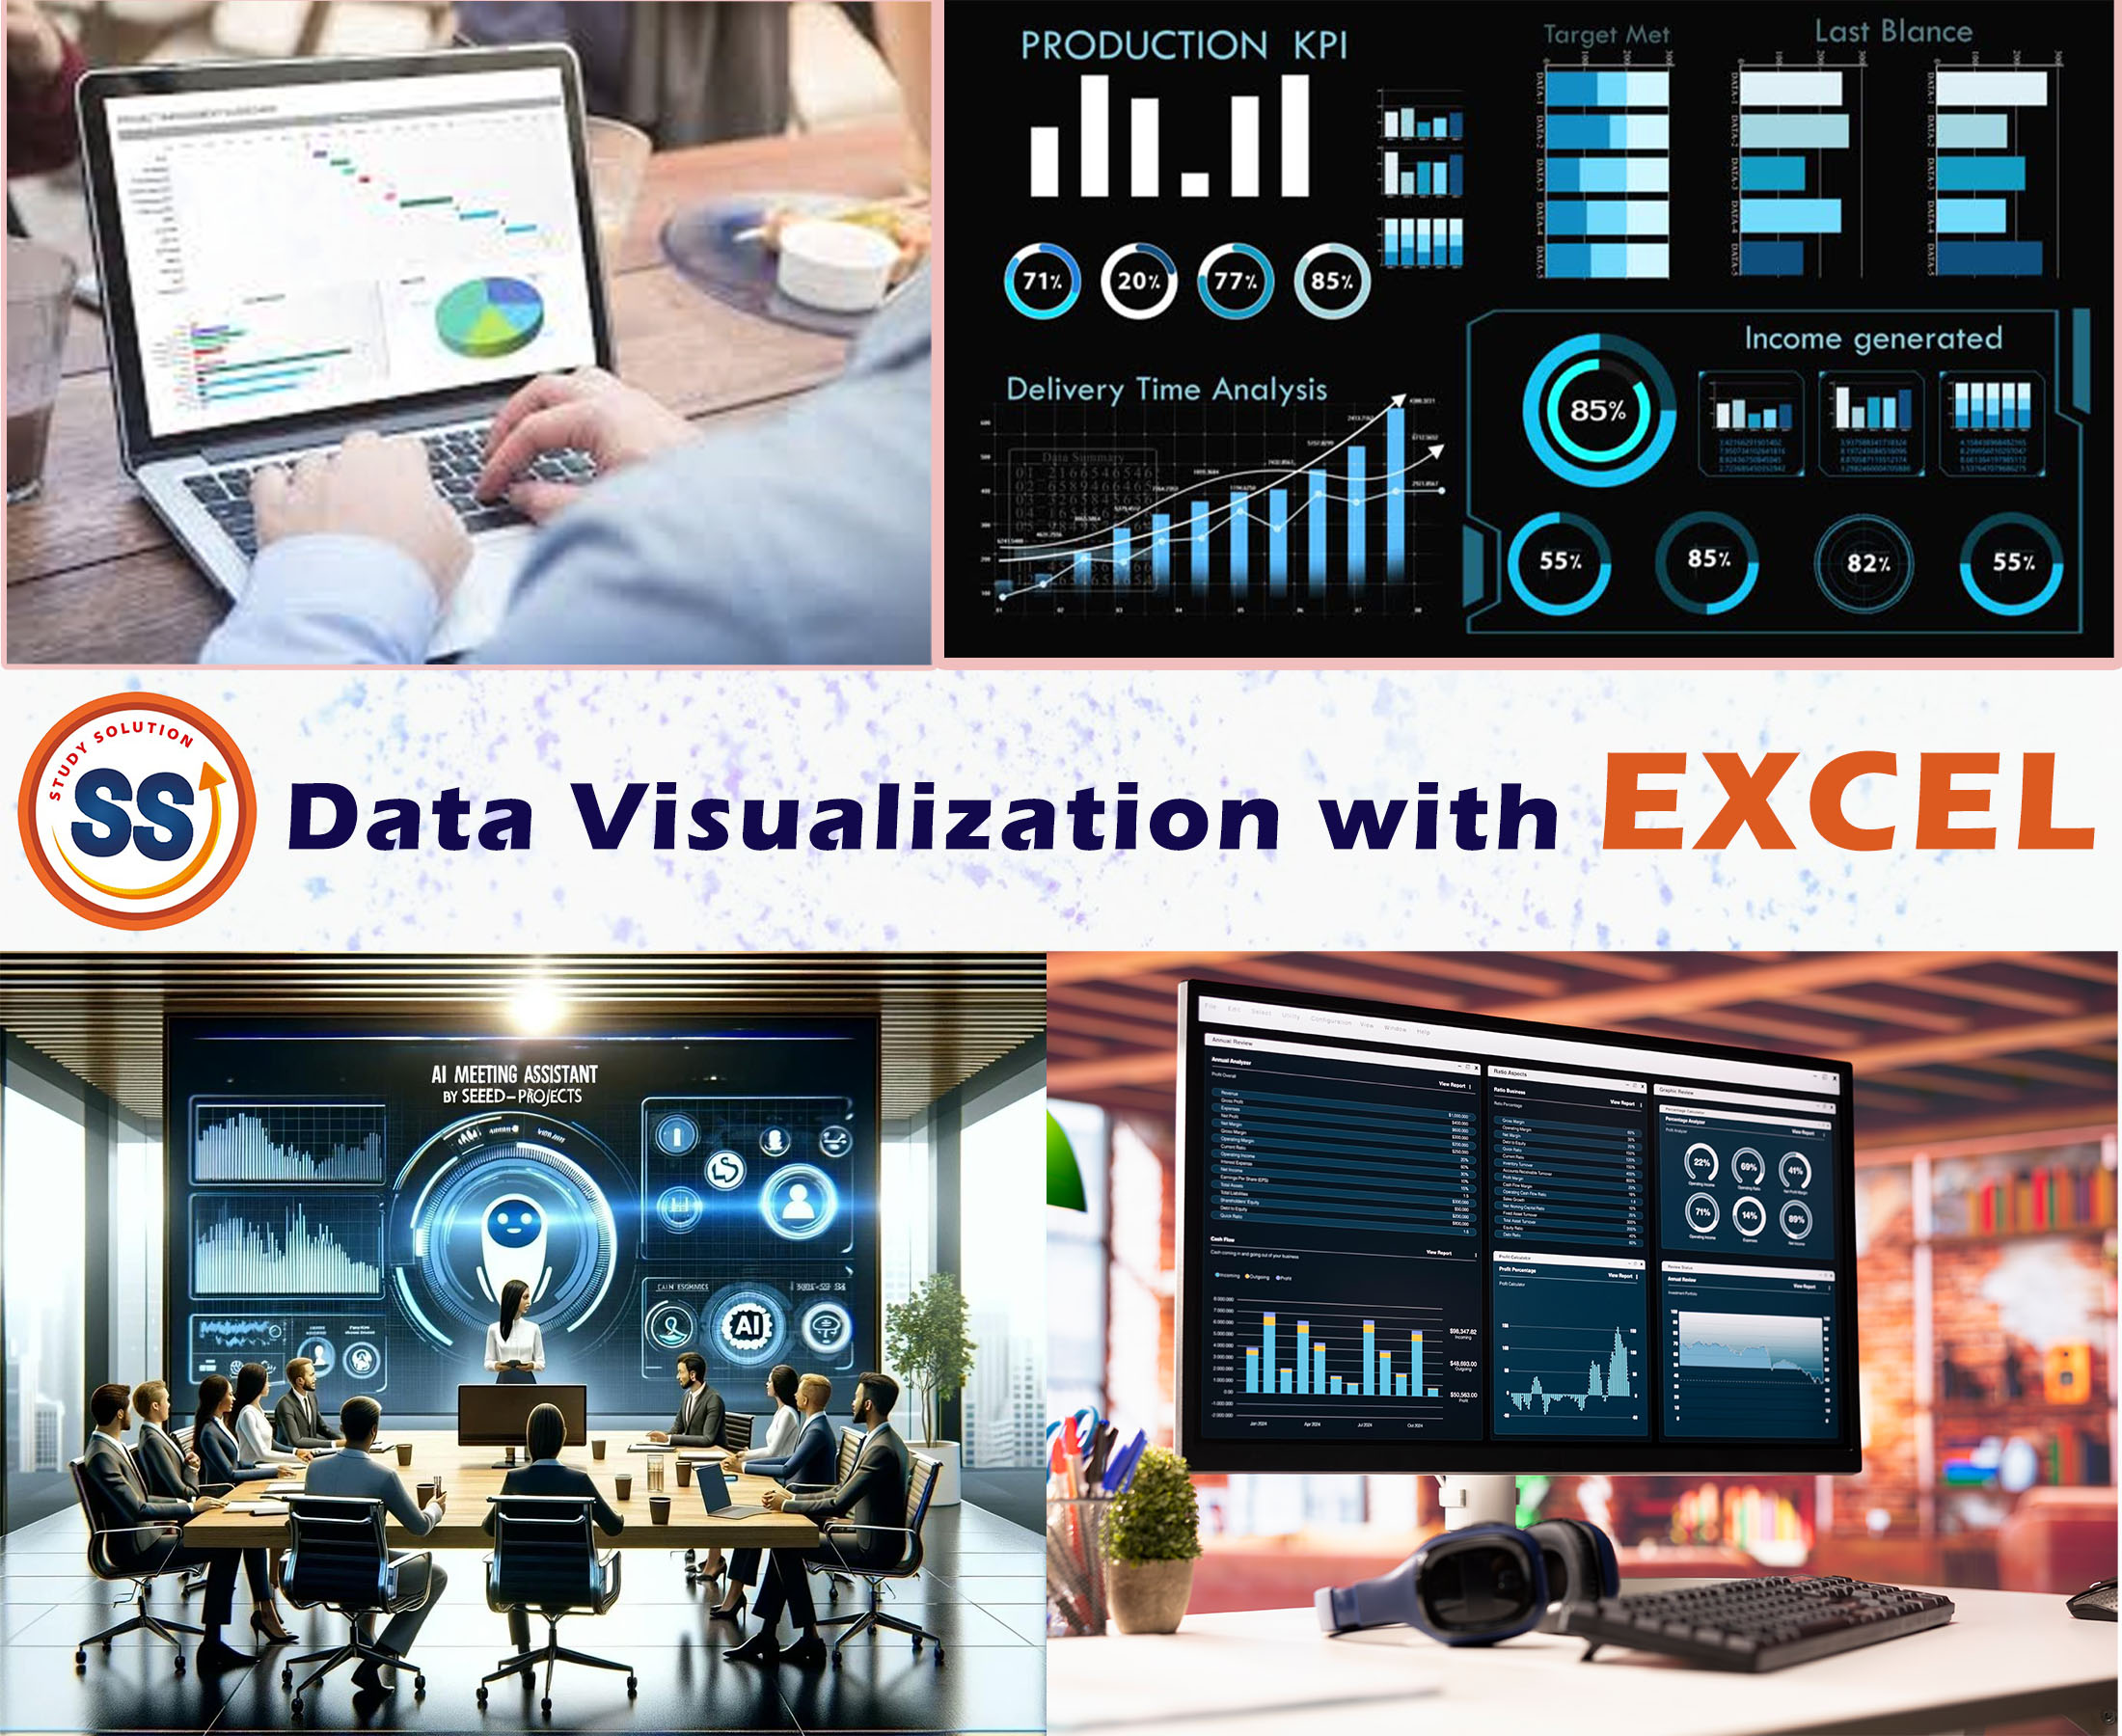
In this course, you will learn how to create professional-level Excel charts and dashboards, analyze data effectively, and present insights with confidence. The training covers everything from data cleaning to advanced visualization techniques using PivotCharts, Conditional Formatting, Sparklines, KPI charts, and dynamic dashboards.
With our Excel certification course, you receive recognized credentials after successfully completing the program—helping you stand out in job applications and professional profiles. Study Solution is known for delivering the best Excel coaching online, with hands-on projects, real-world business datasets, and step-by-step guidance to make you job-ready.
Whether you want to create automated dashboards, improve reporting skills, or start a career in analytics, this Excel data analysis course gives you everything you need to succeed.
⭐ 1. Excel Is the Foundation of All Data Analytics Tools
Before learning Power BI, Tableau, Python, or SQL—you must know Excel.
Most companies still use Excel as the first layer of reporting, and almost every job role requires it.
Excel helps you:
- Clean data
- Analyze trends
- Prepare dashboards
- Create charts & business reports
- Present insights clearly
This is why mastering data visualization in Excel is a must for every modern learner.
👉 https://thestudysolution.in/courses/excel-for-data-visualization/
⭐ 2. Easy to Learn, Powerful Results
The biggest advantage of Excel is its simplicity.
With just drag-and-drop chart options, conditional formatting, and PivotCharts, anyone can build:
- Sales dashboards
- Financial reports
- Performance charts
- KPI scorecards
- Business insights sheets
Because of this, even beginners can quickly start creating professional visualizations.
👉 https://thestudysolution.in/courses/excel-for-data-visualization/
⭐ 3. Supports Work in Every Industry
No matter which field you belong to—Excel data visualization is useful everywhere:
- Banking & Finance: Profit/loss charts, risk analysis
- Retail & Sales: Monthly revenue dashboards
- Education: Student performance reports
- HR: Hiring & attendance dashboards
- Healthcare: Patient data tracking
Having these skills increases your value as an employee and improves your chances of getting hired.
⭐ 4. Learn Excel Online From Anywhere in India
Today, learning Excel is more convenient than ever.
At Study Solution, we offer live online classes that you can join from your home—no need to travel, no time constraints.
Our Online Classes Offer:
- Live instructor-led training
- Screen-sharing demonstrations
- Real-time doubt clearing
- Recorded sessions
- Assignments & practice exercises
Perfect for school students, college students, working professionals, and job seekers.
👉 https://thestudysolution.in/courses/excel-for-data-visualization/
⭐ 5. Certification Helps You Stand Out
Companies prefer candidates with recognized certifications.
After completing the course, you receive an industry-valued certificate from Study Solution that you can add to:
- Resume
- LinkedIn profile
- Job applications
A certified Excel user has significantly higher chances of landing data-related roles.
👉 https://thestudysolution.in/courses/excel-for-data-visualization/
⭐ 6. Real-World Datasets & Practical Examples
Excel can only be mastered through practice. That’s why our course includes hands-on training with real business datasets:
- Sales data
- Marketing campaigns
- Customer feedback
- Financial statements
- HR and operations data
This ensures you learn how companies truly work with data—not just theory but real-life scenarios.
👉 https://thestudysolution.in/courses/excel-for-data-visualization/
⭐ 7. Build Professional Dashboards That Impress Employers
Data visualization in Excel trains you to:
- Build interactive dashboards
- Use slicers & timelines
- Combine multiple charts
- Create dynamic visualizations
- Present insights clearly
Employers love candidates who can present data visually and make business decisions easier.
🌟 Conclusion: Learning Excel for Data Visualization Is a Career Upgrade
Whether you’re a student, beginner, or working professional, Excel is the fastest and most practical skill you can learn today.
It helps you stand out, makes your job easier, and opens the door to advanced analytics tools.
If you want to learn Excel in the most practical, convenient way—
join our Online Excel for Data Visualization Course offered across India.
👉 https://thestudysolution.in/courses/excel-for-data-visualization/
Upgrade your career with professional Excel skills.
Online & Offline Classes | Expert Trainers | Industry-Level Projects | Certification Included
Register Now
📞 Call us: 9836588101 / 9903230400
🌐 Visit: www.thestudysolution.in
📍 Location: 104C Kali Charan Ghosh Road Kolkata- 700050