
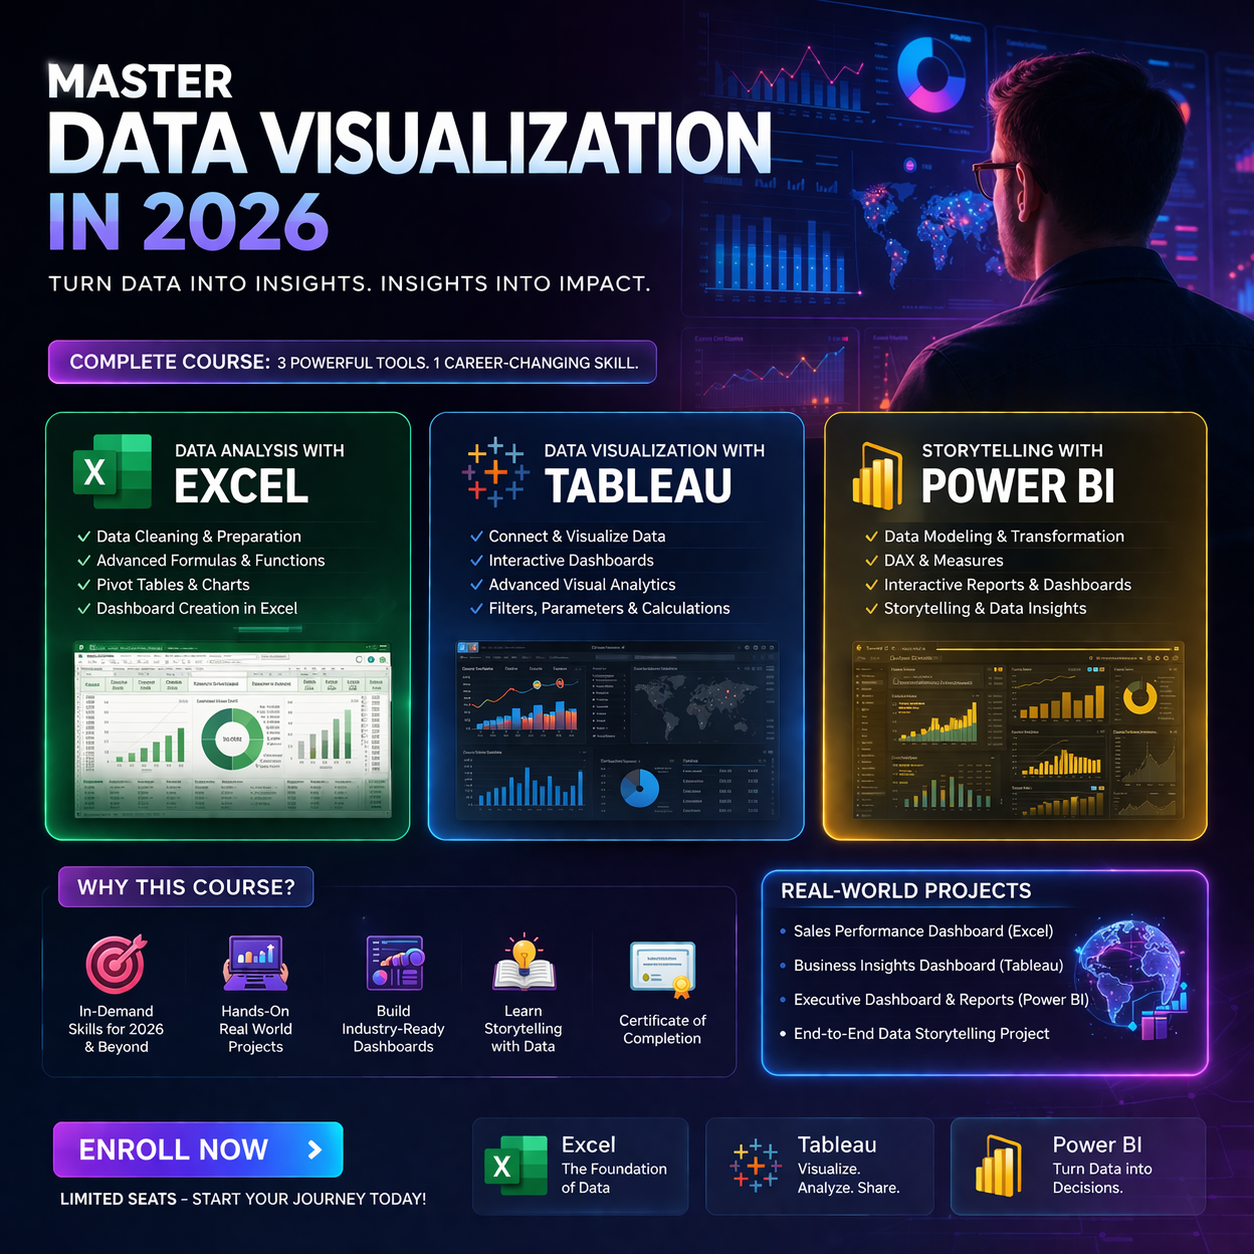
Master Data Visualization, Analysis & Storytelling in 2026
In today’s data-driven world, the ability to analyze data and present it visually is one of the most in-demand skills. Our Best Data Visualization Course 2026 (Excel + Tableau + Power BI) is designed to help you become a complete data professional.
Whether you're a beginner or a working professional, this course covers:
- Data analysis with Excel
- Data visualization with Tableau
- Storytelling with Power BI
- Real-world data analysis tools and techniques
If you're looking to build a career in analytics, business intelligence, or reporting, this course is your perfect starting point.
Why Learn Data Visualization in 2026?
Data is everywhere—but raw data alone is useless without insights. Companies today need professionals who can:
- Transform complex data into simple visuals
- Build interactive dashboards
- Communicate insights through storytelling
Learning data visualization tools like Excel, Tableau, and Power BI helps you:
Make better business decisions
Improve reporting efficiency
Stand out in job interviews
Increase your earning potential
Data Visualization Tools Covered
This course gives hands-on experience with top data analysis tools and data visualization tools:
- Microsoft Excel (Learn more about Excel)
- Tableau
- Microsoft Power BI

These tools are widely used across industries such as:
- Finance
- Marketing
- Healthcare
- E-commerce
- IT & Analytics
Real-World Projects Included
To ensure practical learning, you will work on real-world projects like:
- Sales dashboard using Excel
- Business performance dashboard in Tableau
- Interactive Power BI reports
- Customer analytics and trend analysis

These projects will help you build a strong portfolio.
Who Should Join This Course?
This course is ideal for:
- Students and freshers
- Working professionals
- Business analysts
- Marketing professionals
- Anyone interested in data analysis and visualization tools
No prior experience is required.
Career Opportunities After This Course
After completing this course, you can apply for roles like:
- Data Analyst
- Business Analyst
- Data Visualization Specialist
- BI Developer
With the right skills in data visualization with Tableau, data analysis with Excel, and storytelling with Power BI, you can unlock high-paying job opportunities.
Course Features
Beginner to advanced curriculum
Hands-on projects
Industry-relevant tools
Certification upon completion
Placement assistance
FAQs
What is the best data visualization course in 2026?
This course combining Excel, Tableau, and Power BI is one of the most comprehensive options available.
Do I need coding knowledge?
No, this course is beginner-friendly and does not require coding.
How long does it take to complete?
Typically 6–12 weeks depending on your pace
Go through our popular courses
Data Analytics Course
Master Excel with AI
Social Media Marketing
Enroll Now
Start your journey in data analysis and visualization today. Learn the most in-demand skills and become job-ready in 2026.
Enroll now and transform your career with the Best Data Visualization Course (Excel + Tableau + Power BI).
Call us: 8902093755
WhatsApp Now:Chat on WhatsApp
Website: www.thestudysolution.in
Location: 104C Kali Charan Ghosh Road Kolkata- 700050,WB